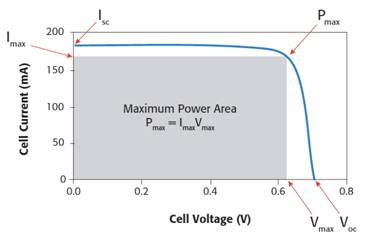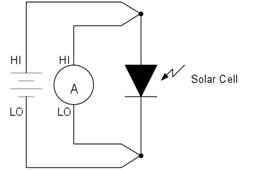


可以利用直流I-V曲线图对PV电池进行评测,I-V图通常表示太阳能电池产生的电流与电压的函数关系(如图2所示)。电池能够产生的最大功率(PMAX)出现在最大电流(IMAX)和电压(VMAX)点,曲线下方的面积表示不同电压下电池能够产生的最大输出功率。我们可以利用基本的测量工具(例如安培计和电压源),或者集成了电源和测量功能的仪器(例如数字源表或者源测量单元SMU),生成这种I-V曲线图。为了适应这类应用的需求,测试设备必须能够在PV电池测量可用的量程范围内提供电压源并吸收电流,同时,提供分析功能以准确测量电流和电压。简化的测量配置如图3所示。
PV cells can be evaluated by means of DC I?V plots that typically show the current produced by a solar cell as a function of the voltage (Fig. 2). The maximum power (PMAX) available from a cell is shown at the point of maximum current (IMAX) and voltage (VMAX), and the area under the curve represents the maximum output power capability of a cell at different voltages. Such an I?V plot can be produced using basic measurement tools, such as an ammeter and voltage source, or an instrument that combines source and measure capabilities, such as a SourceMeter? instrument or Source Measure Unit (SMU). To be suitable for this application, test equipment must be able to source voltage and sink current within a range usable for PV cell measurements and, at the same time, provide the analysis capability to measure current and voltage accurately. A simplified measurement configuration is shown in Fig 3.

电池电流(mA)
最大功率面积
电池电压
图2. 该曲线给出了PV电池的典型正偏特性,其中最大功率(PMAX)出现在最大电流(IMAX)和最大电压(VMAX)的交叉点。
Fig 2. This curve shows the typical forward-biased characteristics of a PV cell, with the maximum power (PMAX) occurring at the junction of the maximum current (IMAX) and the maximum voltage (VMAX).

图3. 对太阳能电池进行I-V曲线测量的典型系统,由一个电流源和一个伏特计组成。
Fig 3. Typical system to make I-V curves on solar cells, consisting of a current source and voltmeter.
测量系统应该支持四线测量模式。采用四线测量技术能够解决引线电阻影响测量精度的问题。例如,可以用其中一对测试引线提供电压源,用另一对引线测量流过电池的电流。重要的是要把测试引线放在距离电池尽可能近一些的地方。
The measurement system should allow for a four-wire measurement to be made. Using a four-wire technique eliminates the lead resistance from affecting the measurement accuracy. For example, one pair of test leads may be used to source voltage and the second pair of leads may be used to measure the current flowing from the cell. It is very important to place the test leads as close as possible to the cell.
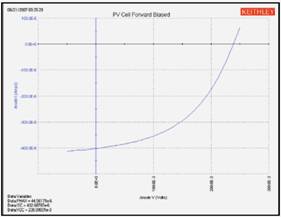
图4给出了利用SMU测出的一种被照射的硅太阳能电池的真实直流I-V曲线。由于SMU能够吸收电流,因此该曲线通过第四象限,并且支持器件析出功率。
An actual DC I-V plot of an illuminated silicon solar cell measured with an SMU is shown in Fig 4. Because an SMU can sink current, the curve passes through the fourth quadrant and allows power to be extracted from the device.

图4. 正偏(被照射的)PV电池的这种典型I-V曲线表示输出电流随电压升高而快速上升的情形。
Fig 4. This typical I?V curve for a forward-biased (illuminated) PV cell indicates rapidly rising output current with increasing voltage.
 /2
/2 
文章评论(0条评论)
登录后参与讨论