上一次讲了2D plot,今天说一下2D plot双坐标。例如:
monthnum = 1:12;
precip = [3.4 3.3 4.3 3.7 3.5 3.7 ... 3.4 3.4 3.4 3.9 4.0 3.8];temp = [16 25 40 48 59 70 ... 77 77 65 56 47 34];figureyyaxis leftplot(monthnum,precip)xlabel('时间')ylabel('P数值')title('预测数据')复制代码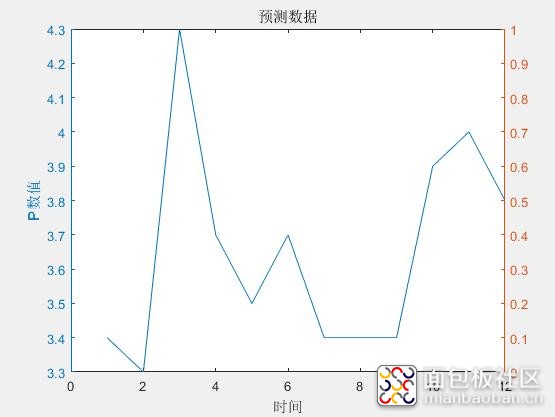
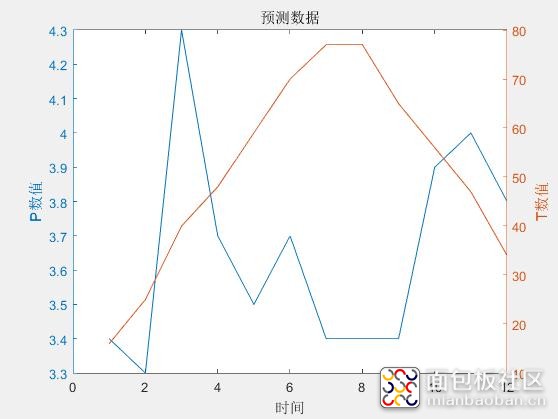
有时候,坐标轴上要显示很多的内容,就需要多坐标轴表示。例如:monthnum = 1:12;
precip = [3.4 3.3 4.3 3.7 3.5 3.7 ... 3.4 3.4 3.4 3.9 4.0 3.8];temp = [16 25 40 48 59 70 ... 77 77 65 56 47 34];figureyyaxis leftplot(monthnum,precip)xlabel('时间')ylabel('P数值')title('预测数据')yyaxis rightplot(monthnum,temp)ylabel('T数值')复制代码显示:
作者: curton, 来源:面包板社区
链接: https://mbb.eet-china.com/blog/uid-me-3876349.html
版权声明:本文为博主原创,未经本人允许,禁止转载!


 /1
/1 


文章评论(0条评论)
登录后参与讨论