function [sys,x0,str,ts] = spacemodel(t,x,u,flag)
%设置系统的初始值、长度、时间等switch flag,case 0, [sys,x0,str,ts]=mdlInitializeSizes;case 3, sys=mdlOutputs(t,x,u);case {2,4,9} sys=[];otherwise error(['Unhandled flag = ',num2str(flag)]);end%以上的选择参数复制代码function [sys,x0,str,ts]=mdlInitializeSizes
sizes = simsizes;sizes.NumOutputs = 2;sizes.NumInputs = 6;sizes.DirFeedthrough = 1;sizes.NumSampleTimes = 1;sys = simsizes(sizes);x0 = [];str = [];ts = [0 0];%以上是输入信号复制代码function sys=mdlOutputs(t,x,u)
R1=u(1);dr1=0;R2=u(2);dr2=0;x(1)=u(3);x(2)=u(4);x(3)=u(5);x(4)=u(6);e1=R1-x(1);e2=R2-x(3);e=[e1;e2];de1=dr1-x(2);de2=dr2-x(4);de=[de1;de2];Kp=[50 0;0 50];Kd=[50 0;0 50];tol=Kp*e+Kd*de;sys(1)=tol(1);sys(2)=tol(2);%以上是模型输出信号复制代码
这个是控制模型chap2_1ctrl,给定一个系统的模型。
function [sys,x0,str,ts] = spacemodel(t,x,u,flag)
switch flag,case 0, [sys,x0,str,ts]=mdlInitializeSizes;case 3, sys=mdlOutputs(t,x,u);case {2,4,9} sys=[];otherwise error(['Unhandled flag = ',num2str(flag)]);endfunction [sys,x0,str,ts]=mdlInitializeSizessizes = simsizes;sizes.NumOutputs = 2;sizes.NumInputs = 6;sizes.DirFeedthrough = 1;sizes.NumSampleTimes = 1;sys = simsizes(sizes);x0 = [];str = [];ts = [0 0];function sys=mdlOutputs(t,x,u)R1=u(1);dr1=0;R2=u(2);dr2=0;x(1)=u(3);x(2)=u(4);x(3)=u(5);x(4)=u(6);e1=R1-x(1);e2=R2-x(3);e=[e1;e2];de1=dr1-x(2);de2=dr2-x(4);de=[de1;de2];Kp=[50 0;0 50];Kd=[50 0;0 50];tol=Kp*e+Kd*de;sys(1)=tol(1);sys(2)=tol(2);复制代码
这个是控制模型chap2_1plant,检测系统的模型。
本身这两个模型是一样的,唯一的不同点,一个是给定的系统模型,可以认为是精确的,后一个模型是检测模型,有一定的误差。
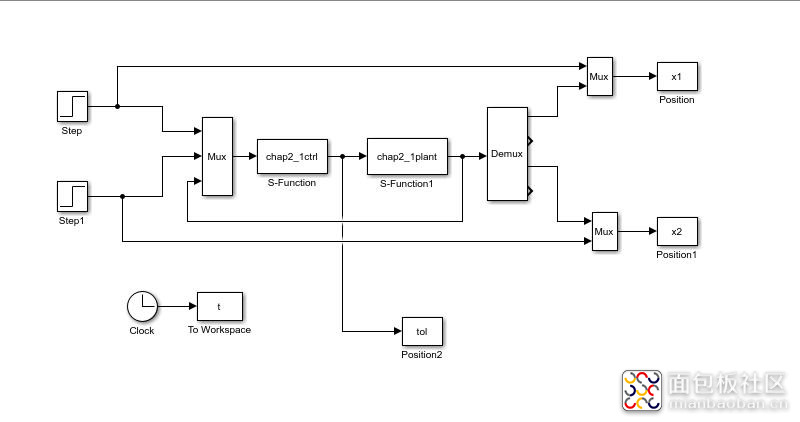
模型如图所示。

close all;
figure(1);subplot(211);plot(t,x1(:,1),'r',t,x1(:,2),'b');xlabel('time(s)');ylabel('position tracking of link 1');subplot(212);plot(t,x2(:,1),'r',t,x2(:,2),'b');xlabel('time(s)');ylabel('position tracking of link 2');figure(2);subplot(211);plot(t,tol(:,1),'r');xlabel('time(s)');ylabel('tol1');subplot(212);plot(t,tol(:,2),'r');xlabel('time(s)');ylabel('tol2');%以上是显示图形程序复制代码
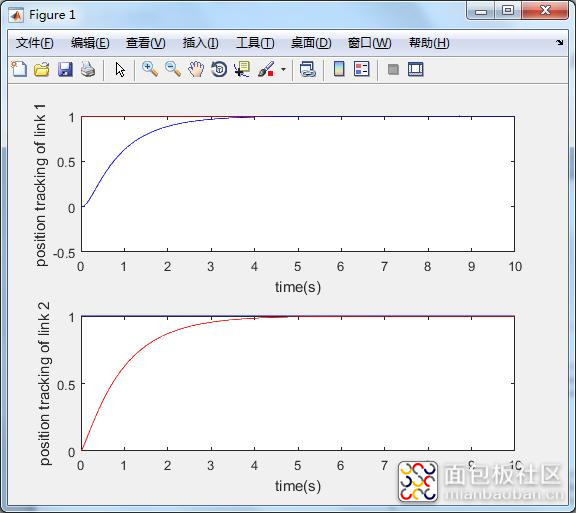
仿真后的结果如图所示。

需要源程序或者有任何问题请联系 scut_08@sina.com


 /1
/1 
文章评论(0条评论)
登录后参与讨论