(一)初阶绘图
(1) hold on / off
将多幅图像显示在一张图
hold on;
plot(cos(0:pi/20:2*pi));
plot(sin(0:pi/20:2*pi));
hold off;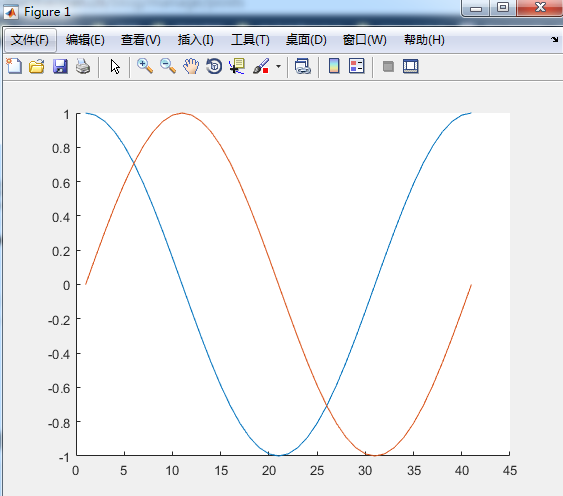 (2)改变图像的外观
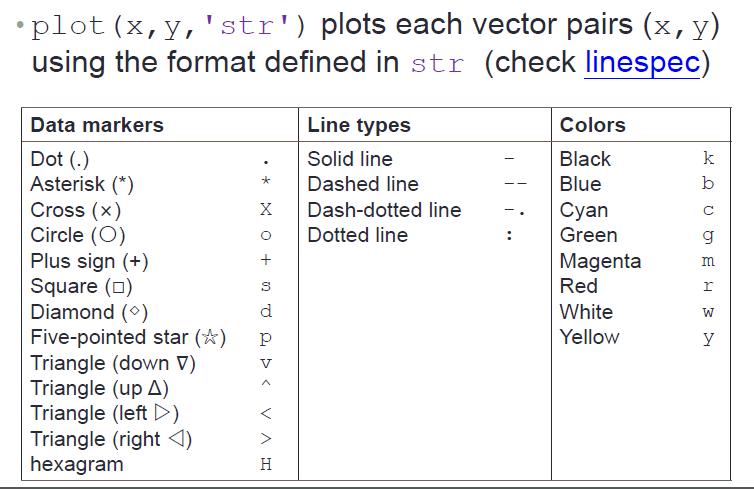
hold on;
plot(cos(0:pi/20:2*pi),'or');
plot(sin(0:pi/20:2*pi),'xg');
hold off;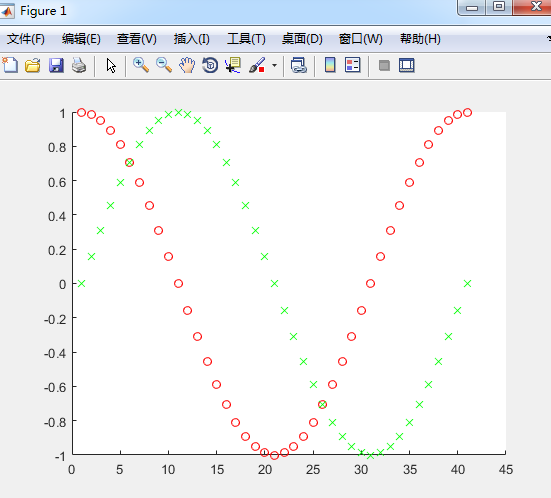 (3)为图像添加图例
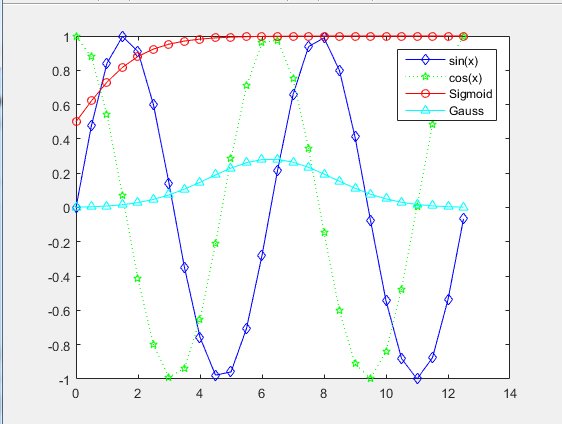
clear all;
x=0:0.5:4*pi;
y=sin(x);
h=cos(x);
w=1./(1+exp(-x));
g=(1/(2*pi*2)^0.5).*exp((-1.*(x-2*pi).^2)./(2*2^2));
plot(x,y,'bd-',x,h,'gp:',x,w,'ro-',x,g,'c^-');
legend('sin(x)','cos(x)','Sigmoid','Gauss');
 (4)title 和 label
clear all;
x=0:0.1:2*pi;
y1=sin(x);
y2=exp(-x);
plot(x,y1,'--*',x,y2,':o');
xlabel('t=0 to 2\pi');
ylabel('values of sin(t) and e^{-x}');
title('Function Plots of sin(t) and e^{-x}');
legend('sin(t)','e^{-x}');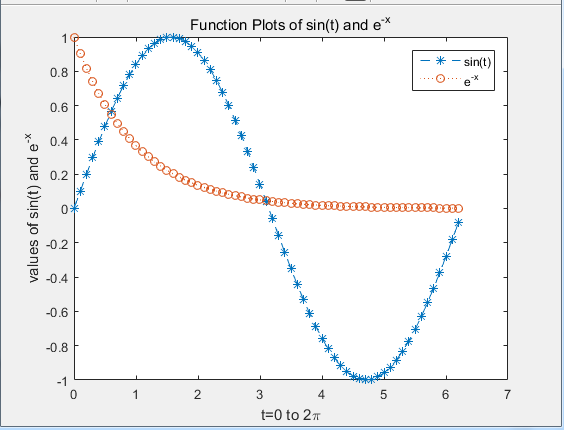
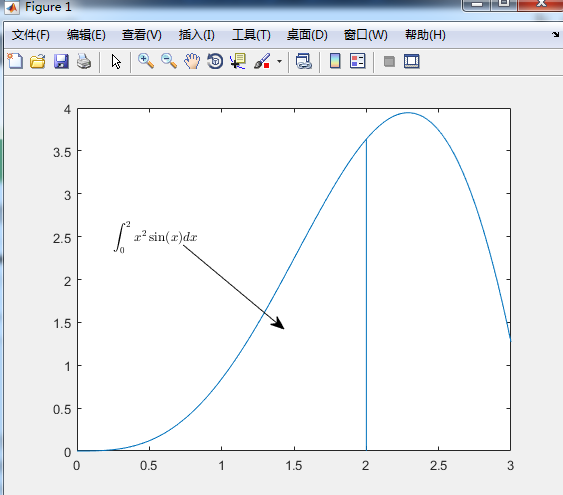
(5)text()和annotation()-箭头
clear all
x=linspace(0,3);
y=x.^2.*sin(x);
plot(x,y);
line([2,2],[0,2^2*sin(2)]);
str='$$ \int_{0}^{2} x^2\sin(x) dx $$';
text(0.25,2.5,str,'Interpreter','latex');
annotation('arrow','X',[0.32,0.5],'Y',[0.6,0.4]);
(6)图形调整
字体,字体大小,线宽,数轴范围、标记的位置
(6.1)一张图的构成

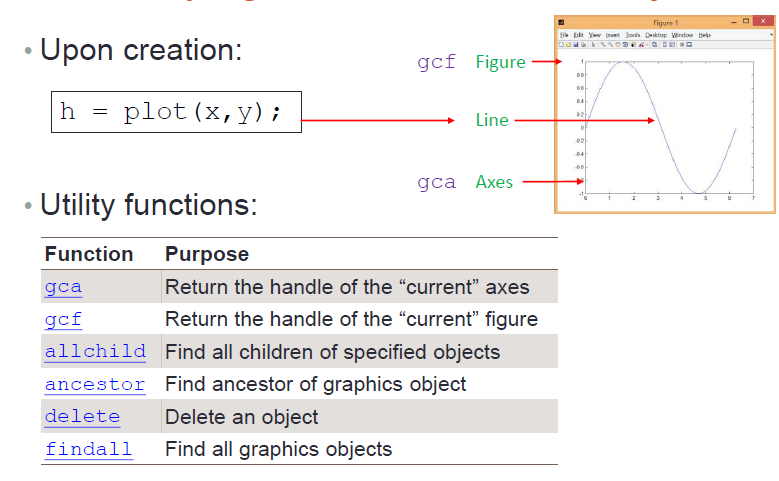
(6.2.1)获取目标的句柄的方法:get()
>> x=linspace(0,2*pi,1000);
>> y=sin(x);
>> plot(x,y);
>> h=plot(x,y);
>> get(h)
AlignVertexCenters: 'off'
Annotation: [1x1 matlab.graphics.eventdata.Annotation]
BeingDeleted: 'off'
BusyAction: 'queue'
ButtonDownFcn: ''
Children: [0x0 GraphicsPlaceholder]
Clipping: 'on'
Color: [0 0.4470 0.7410]
CreateFcn: ''
DeleteFcn: ''
DisplayName: ''
HandleVisibility: 'on'
HitTest: 'on'
Interruptible: 'on'
LineJoin: 'round'
LineStyle: '-'
LineWidth: 0.5000
Marker: 'none'
MarkerEdgeColor: 'auto'
MarkerFaceColor: 'none'
MarkerSize: 6
Parent: [1x1 Axes]
PickableParts: 'visible'
Selected: 'off'
SelectionHighlight: 'on'
Tag: ''
Type: 'line'
UIContextMenu: [0x0 GraphicsPlaceholder]
UserData: []
Visible: 'on'
XData: [1x1000 double]
XDataMode: 'manual'
XDataSource: ''
YData: [1x1000 double]
YDataSource: ''
ZData: [1x0 double]
ZDataSource: ''
>> get(gca)
ALim: [0 1]
ALimMode: 'auto'
ActivePositionProperty: 'outerposition'
AmbientLightColor: [1 1 1]
BeingDeleted: 'off'
Box: 'on'
BoxStyle: 'back'
BusyAction: 'queue'
ButtonDownFcn: ''
CLim: [0 1]
CLimMode: 'auto'
CameraPosition: [3.5000 0 17.3205]
CameraPositionMode: 'auto'
CameraTarget: [3.5000 0 0]
CameraTargetMode: 'auto'
CameraUpVector: [0 1 0]
CameraUpVectorMode: 'auto'
CameraViewAngle: 6.6086
CameraViewAngleMode: 'auto'
Children: [1x1 Line]
Clipping: 'on'
ClippingStyle: '3dbox'
Color: [1 1 1]
ColorOrder: [7x3 double]
ColorOrderIndex: 2
CreateFcn: ''
CurrentPoint: [2x3 double]
DataAspectRatio: [3.5000 1 1]
DataAspectRatioMode: 'auto'
DeleteFcn: ''
FontAngle: 'normal'
FontName: 'Helvetica'
FontSize: 10
FontSmoothing: 'on'
FontUnits: 'points'
FontWeight: 'normal'
GridAlpha: 0.1500
GridAlphaMode: 'auto'
GridColor: [0.1500 0.1500 0.1500]
GridColorMode: 'auto'
GridLineStyle: '-'
HandleVisibility: 'on'
HitTest: 'on'
Interruptible: 'on'
LabelFontSizeMultiplier: 1.1000
Layer: 'bottom'
LineStyleOrder: '-'
LineStyleOrderIndex: 1
LineWidth: 0.5000
MinorGridAlpha: 0.2500
MinorGridAlphaMode: 'auto'
MinorGridColor: [0.1000 0.1000 0.1000]
MinorGridColorMode: 'auto'
MinorGridLineStyle: ':'
NextPlot: 'replace'
OuterPosition: [0 0 1 1]
Parent: [1x1 Figure]
PickableParts: 'visible'
PlotBoxAspectRatio: [1 0.7903 0.7903]
PlotBoxAspectRatioMode: 'auto'
Position: [1x4 double]
Projection: 'orthographic'
Selected: 'off'
SelectionHighlight: 'on'
SortMethod: 'childorder'
Tag: ''
TickDir: 'in'
TickDirMode: 'auto'
TickLabelInterpreter: 'tex'
TickLength: [0.0100 0.0250]
TightInset: [1x4 double]
Title: [1x1 Text]
TitleFontSizeMultiplier: 1.1000
TitleFontWeight: 'normal'
Type: 'axes'
UIContextMenu: [0x0 GraphicsPlaceholder]
Units: 'normalized'
UserData: []
View: [0 90]
Visible: 'on'
XAxis: [1x1 NumericRuler]
XAxisLocation: 'bottom'
XColor: [0.1500 0.1500 0.1500]
XColorMode: 'auto'
XDir: 'normal'
XGrid: 'off'
XLabel: [1x1 Text]
XLim: [0 7]
XLimMode: 'auto'
XMinorGrid: 'off'
XMinorTick: 'off'
XScale: 'linear'
XTick: [0 1 2 3 4 5 6 7]
XTickLabel: {8x1 cell}
XTickLabelMode: 'auto'
XTickLabelRotation: 0
XTickMode: 'auto'
YAxis: [1x1 NumericRuler]
YAxisLocation: 'left'
YColor: [0.1500 0.1500 0.1500]
YColorMode: 'auto'
YDir: 'normal'
YGrid: 'off'
YLabel: [1x1 Text]
YLim: [-1 1]
YLimMode: 'auto'
YMinorGrid: 'off'
YMinorTick: 'off'
YScale: 'linear'
YTick: [1x11 double]
YTickLabel: {11x1 cell}
YTickLabelMode: 'auto'
YTickLabelRotation: 0
YTickMode: 'auto'
ZAxis: [1x1 NumericRuler]
ZColor: [0.1500 0.1500 0.1500]
ZColorMode: 'auto'
ZDir: 'normal'
ZGrid: 'off'
ZLabel: [1x1 Text]
ZLim: [-1 1]
ZLimMode: 'auto'
ZMinorGrid: 'off'
ZMinorTick: 'off'
ZScale: 'linear'
ZTick: [-1 0 1]
ZTickLabel: ''
ZTickLabelMode: 'auto'
ZTickLabelRotation: 0
ZTickMode: 'auto'
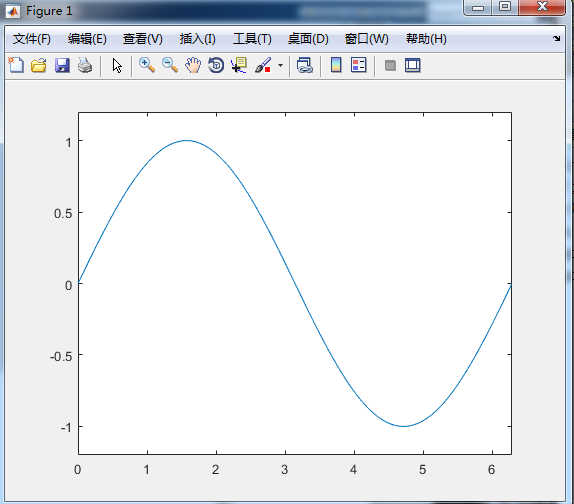
(6.2.2)
原图像
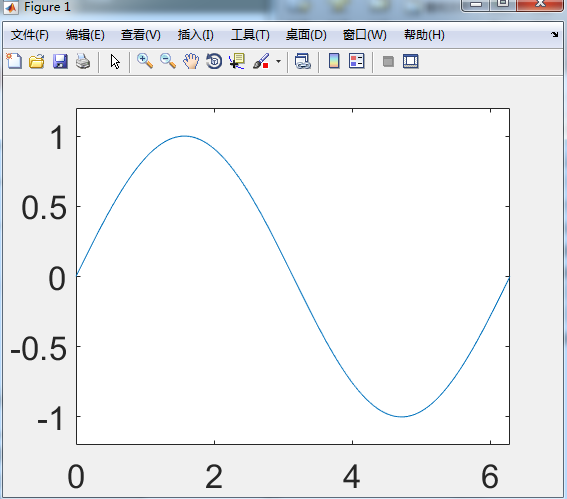
 >> set(gca,'XLim',[0 2*pi]);
>> set(gca,'YLim',[-1.2,1.2]);
或者
>> xlim([0,2*pi]);
>> ylim([-1.2,1.2]);
>>
修改后的图像
>> set(gca,'FontSize',25)
>> set(gca,'XTick',0:pi/2:2*pi);
>> set(gca,'XTickLabel',0:90:360);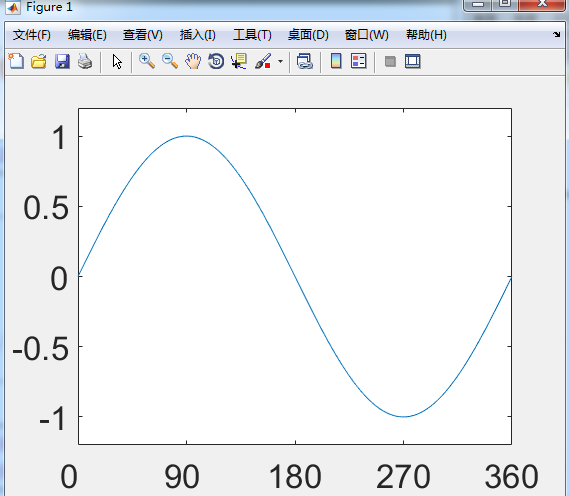
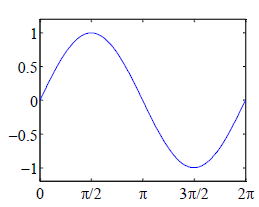
>> set(gca,'FontName','symbol');
>> set(gca,'XTickLabel',{'0','p/2','p','3p/2','2p'})
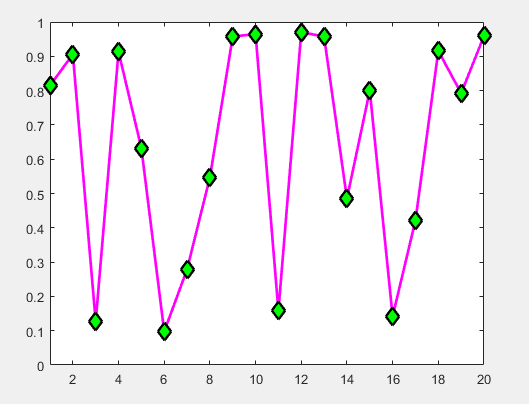
(6.3) Marker
>> clear
>> x=rand(20,1);
>> set(gca,'FontSize',18);
>> plot(x,'-md','LineWidth',2,'MarkerEdgeColor','k',...)
'MarkerFaceColor','g','MarkerSize',10)
>> xlim([1,20])
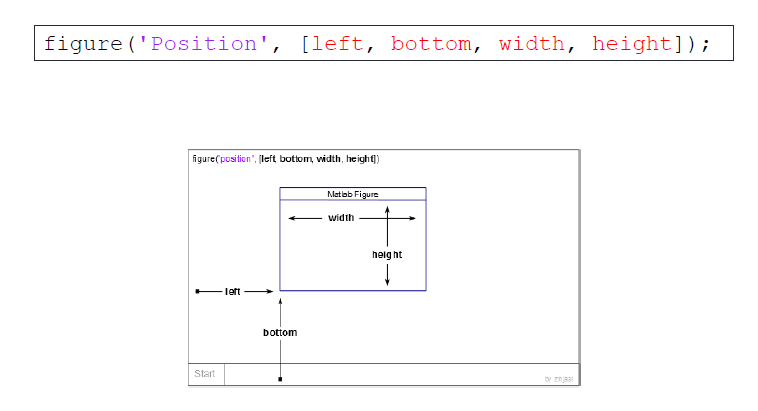
(6.4)图形的位置和大小
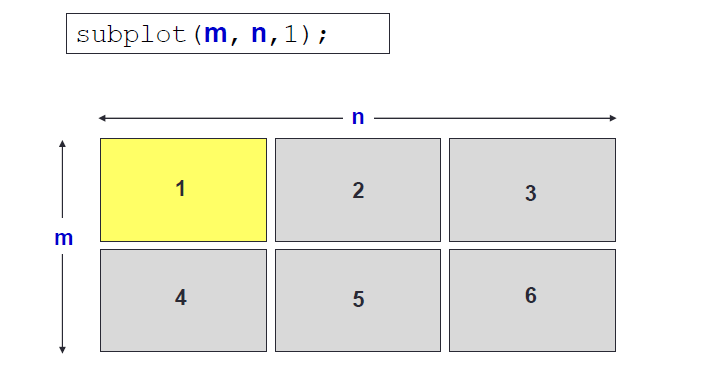
 一张图里画多幅图像
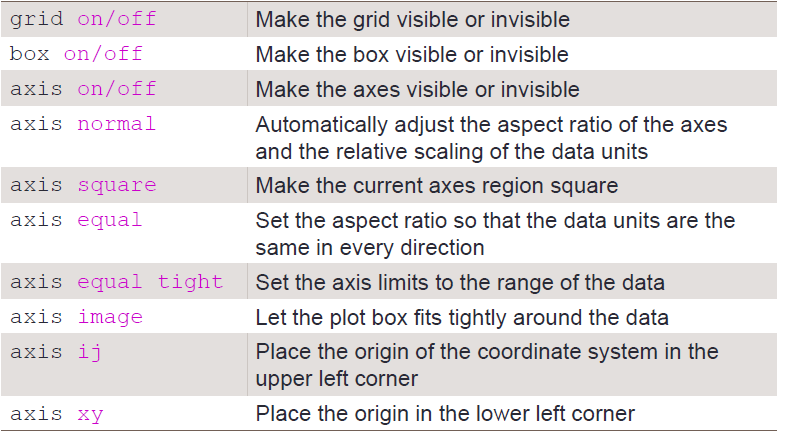
控制 grid,box,axis
保存图像到文件
 (二)高阶绘图
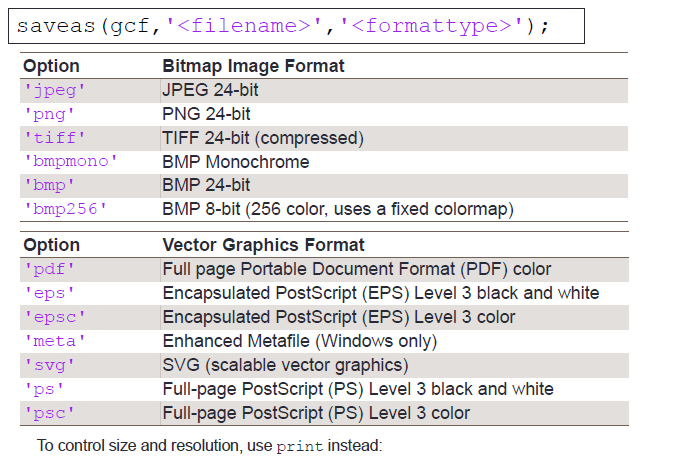
1、Logarithm Plots
clear all
x=logspace(-1,1,100);
y=x.^2;
subplot(2,2,1);
plot(x,y);
title('Plot');
subplot(2,2,2);
semilogx(x,y);
title('Semilogx');
subplot(2,2,3);
semilogy(x,y);
title('Semilogy');
subplot(2,2,4);
loglog(x,y);
title('LogLog');
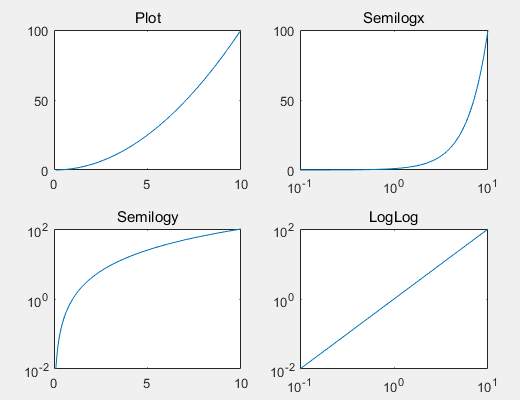 2、plotyy()
clear all
x=0:0.01:20;
y1=200*exp(-0.05*x).*sin(x);
y2=0.8*exp(-0.5*x).*sin(10*x);
[AX,H1,H2]=plotyy(x,y1,x,y2);
set(get(AX(1),'Ylabel'),'String','Left Y-axis');
set(get(AX(2),'Ylabel'),'String','Right Y-axis');
title('Labeling plotyy');
set(H1,'LineStyle','--');
set(H2,'LineStyle',':');
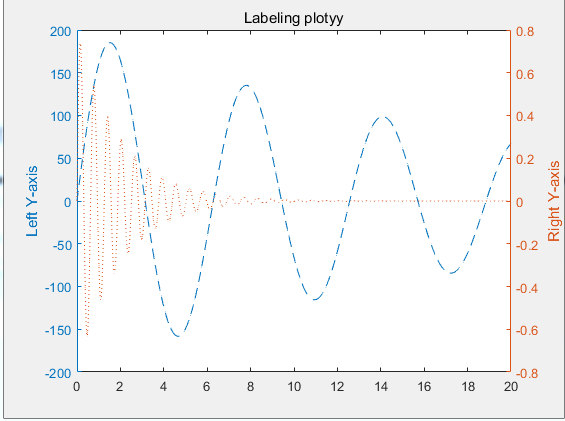 3、histogram (统计图)
看整体的情况
clear all
y=randn(1,1000);
subplot(2,1,1);
hist(y,10);
title('Bins=10');
subplot(2,1,2);
hist(y,50);
title('Bins=50');
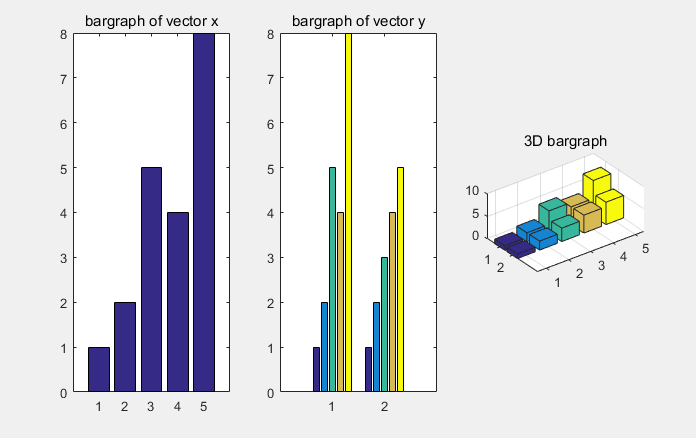
4、Bar Charts (看个别情况)
clear all
x=[1 2 5 4 8];
y=[x;1:5];
subplot(1,3,1);bar(x);title('bargraph of vector x');
subplot(1,3,2);bar(y);title('bargraph of vector y');
subplot(1,3,3);bar3(y);title('3D bargraph');
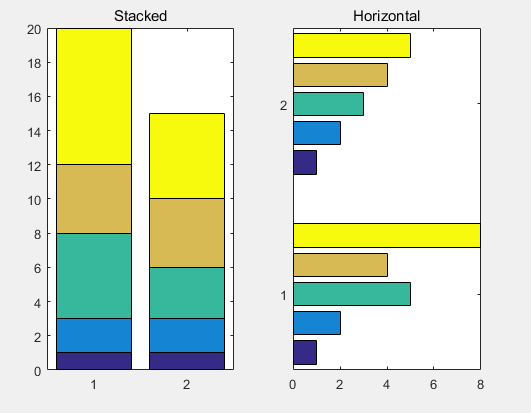
5、Stacked and Horizontal Bar Charts
clear all
x=[1 2 5 4 8];
y=[x;1:5];
subplot(1,2,1);
bar(y,'stacked');
title('Stacked');
subplot(1,2,2);
barh(y);
title('Horizontal');
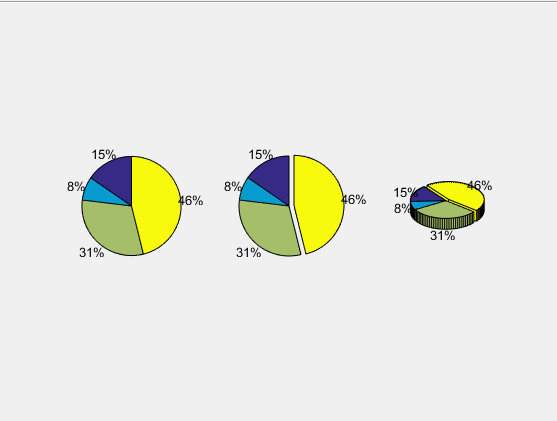
6、Pie Charts
clear all
a=[10 5 20 30];
subplot(1,3,1);pie(a);
subplot(1,3,2);pie(a,[0,0,0,1]);
subplot(1,3,3);pie3(a,[0,0,0,1]);
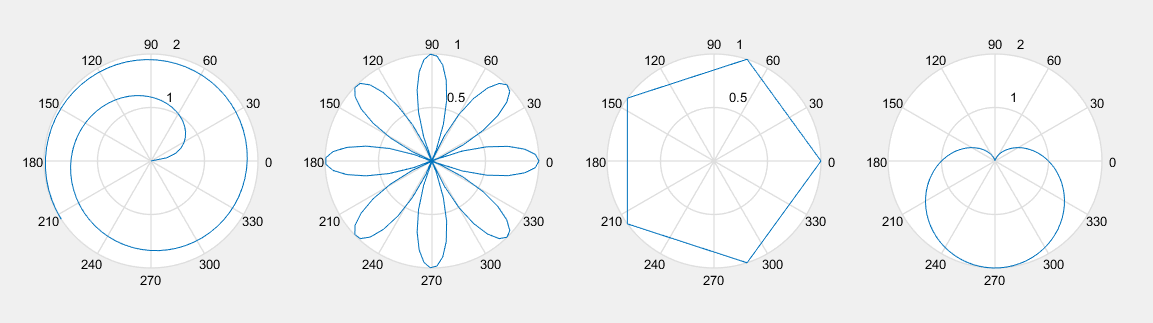
7、Polar Chart
clear all
x=1:100;
theta=x/10;
r=log10(x);
subplot(1,4,1);polar(theta,r);
theta=linspace(0,2*pi);r=cos(4*theta);
subplot(1,4,2);polar(theta,r);
theta=linspace(0,2*pi,6);r=ones(1,length(theta));
subplot(1,4,3);polar(theta,r);
theta=linspace(0,2*pi);r=1-sin(theta);
subplot(1,4,4);polar(theta,r);
8、Stairs and stem charts
clear all
x=linspace(0,4*pi,40);y=sin(x);
subplot(1,2,1);stairs(y);
subplot(1,2,2);stem(y);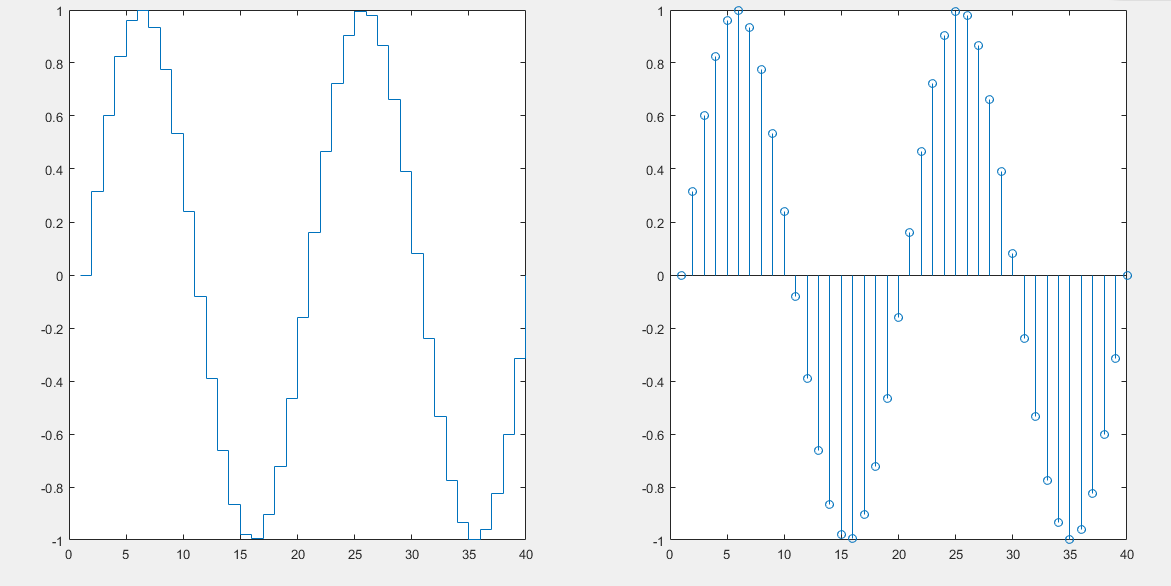
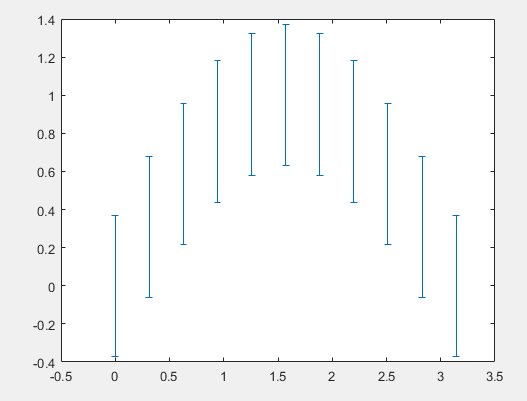
9、Error bar
clear all
x=0:pi/10:pi;
y=sin(x);
e=std(y)*ones(size(x));
errorbar(x,y,e);
 10、fill()
clear all;
t=(1:2:15)'*pi/8;
x=sin(t);
y=cos(t);
fill(x,y,'r');axis square off;
text(0,0,'STOP','Color','w','FontSize',80,...
'FontWeight','bold','HorizontalAlignment','center');

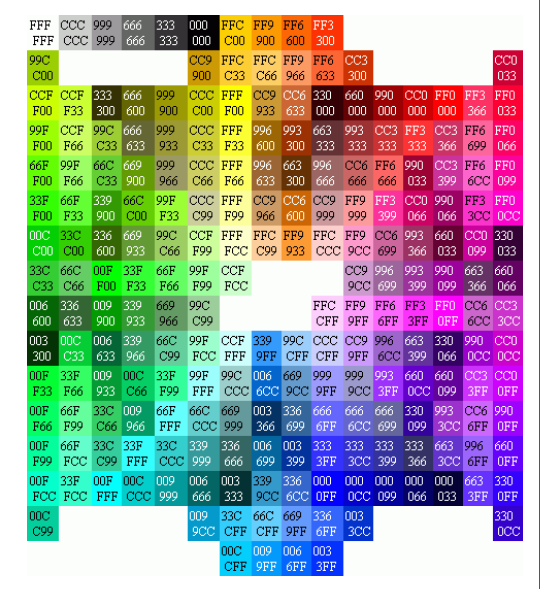
11、配色的设置
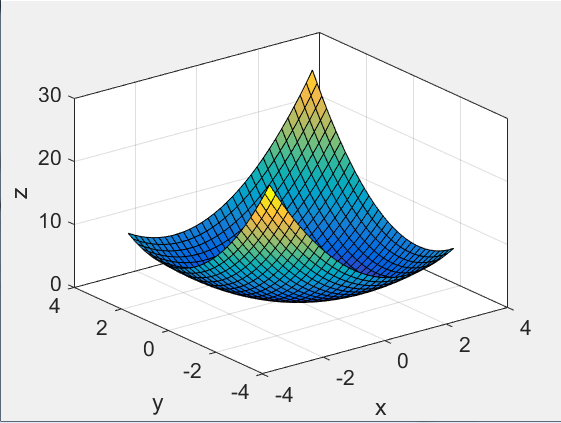
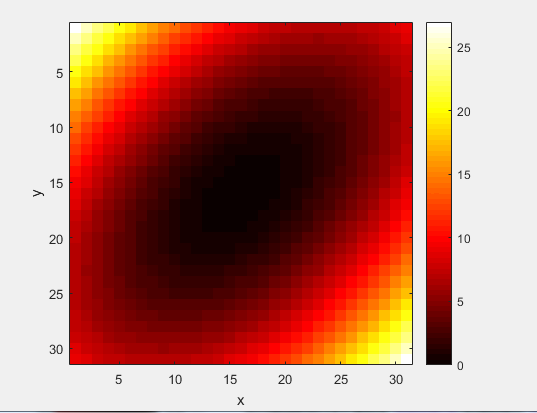
12、以照片的方式查看图 imagesc()
clear all
[x,y]=meshgrid(-3:.2:3,-3:.2:3);
z=x.^2+x.*y+y.^2;
surf(x,y,z);
box on;
set(gca,'FontSize',16);
zlabel('z');
xlim([-4 4]);xlabel('x');
ylim([-4 4]);ylabel('y');
imagesc(z);axis square;xlabel('x');ylabel('y');colorbar;
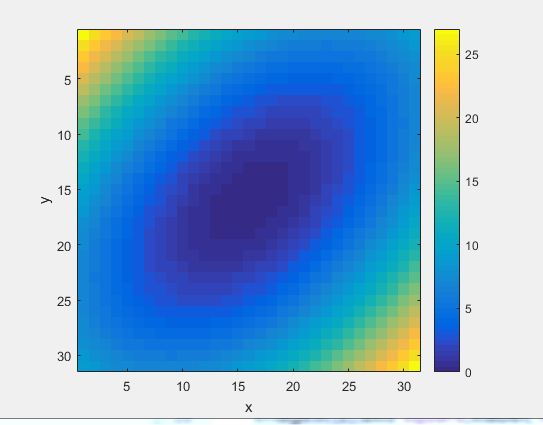
colormap(hot);
13、3D 画图
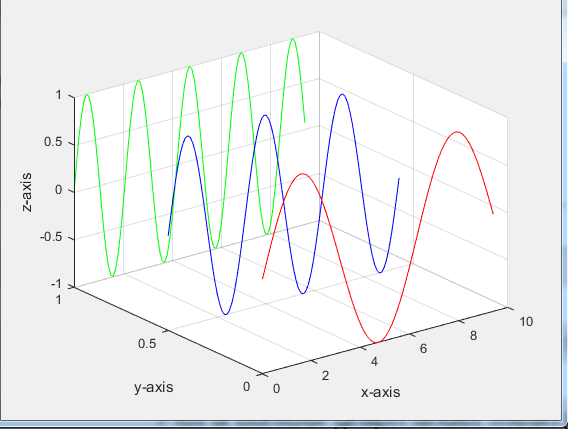
13.1 plot3()
clear all
x=0:0.1:3*pi;
z1=sin(x);
z2=sin(2*x);
z3=sin(3*x);
y1=zeros(size(x));
y3=ones(size(x));
y2=y3./2;
plot3(x,y1,z1,'r',x,y2,z2,'b',x,y3,z3,'g');
grid on;
xlabel('x-axis');ylabel('y-axis');zlabel('z-axis');
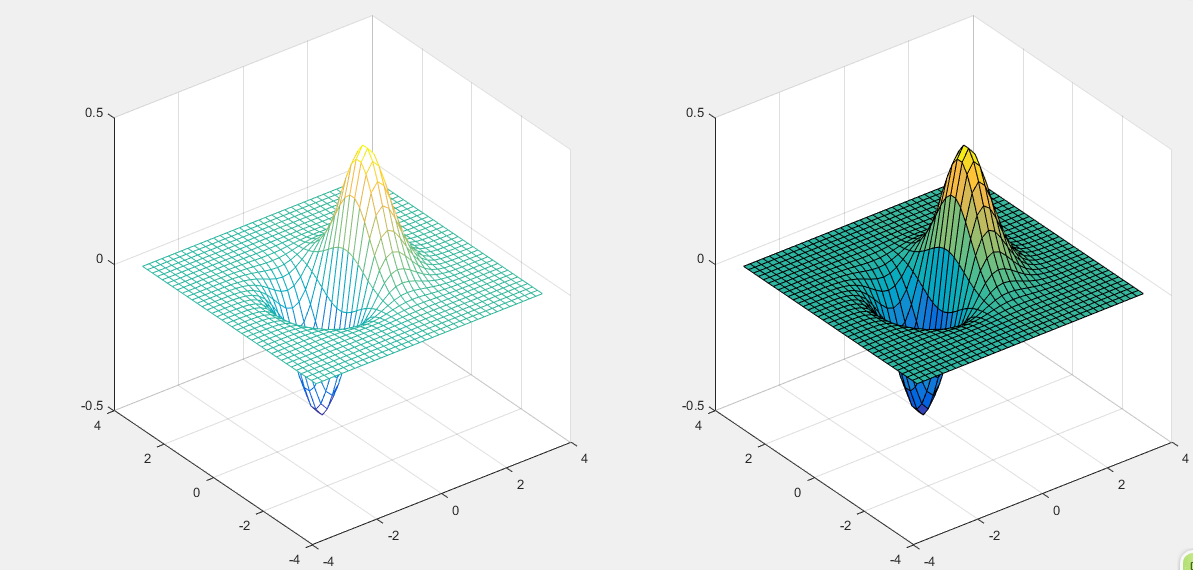
13.2 Surface Plots mesh() 和 surf()
clear all;
x=-3.5:0.2:3.5;
y=-3.5:0.2:3.5;
[X,Y]=meshgrid(x,y);
Z=X.*exp(-X.^2-Y.^2);
subplot(1,2,1);mesh(X,Y,Z);
subplot(1,2,2);surf(X,Y,Z);
13.3 contoour() 将3D图投影到2D平面
clear all;
x=-3.5:0.2:3.5;
y=-3.5:0.2:3.5;
[X,Y]=meshgrid(x,y);
Z=X.*exp(-X.^2-Y.^2);
subplot(2,1,1);mesh(X,Y,Z);
axis square;
subplot(2,1,2);
contour(X,Y,Z);
axis square;
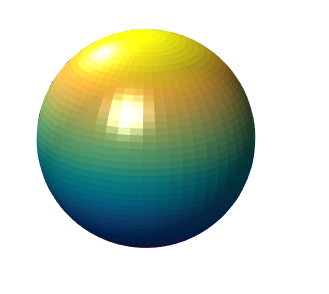
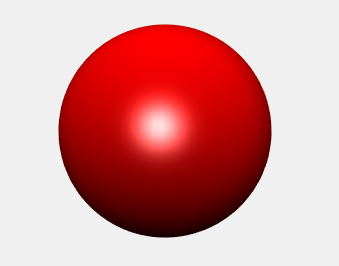
13.4 View Angle: view()
clear all;
sphere(50);shading flat;
light('Position',[1 3 2]);
light('Position',[-3 -1 3]);
material shiny;
axis vis3d off;
set(gcf,'Color',[1 1 1]);
view(-45,20);
 13.5 light()
clear all;
[X,Y,Z]=sphere(64);
h=surf(X,Y,Z);
axis square vis3d off;
reds=zeros(256,3);
reds(:,1)=(0:256.-1)/255;
colormap(reds); shading interp; lighting phong;
set(h,'AmbientStrength',0.75,'DiffuseStrength',0.5);
L1=light('Position',[-1,-1,-1]);
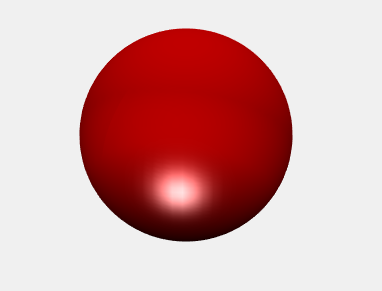
set(L1,'Position',[-1,-1,1]);
set(L1,'Color','g');
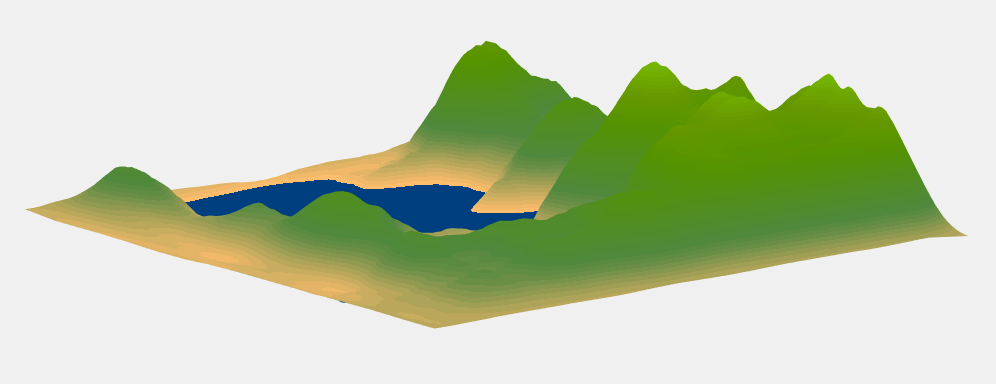
14、练习
clear all;
load cape;
X=conv2(ones(9,9)/81,cumsum(cumsum(randn(100,100)),2));
surf(X,'EdgeColor','none','EdgeLighting','Phong',...
'FaceColor','interp');
colormap(map);
caxis([-10,300]);
grid off; axis off;

 (2)改变图像的外观
 (3)为图像添加图例
 (4)title 和 label


 >> set(gca,'XLim',[0 2*pi]);


 一张图里画多幅图像

 (二)高阶绘图
 2、plotyy()
 3、histogram (统计图)


 10、fill()


 13.5 light()


 /4
/4 


curton 2019-5-3 12:09