上一次讲了三维画图,今天说一下约束测量画图。例如:
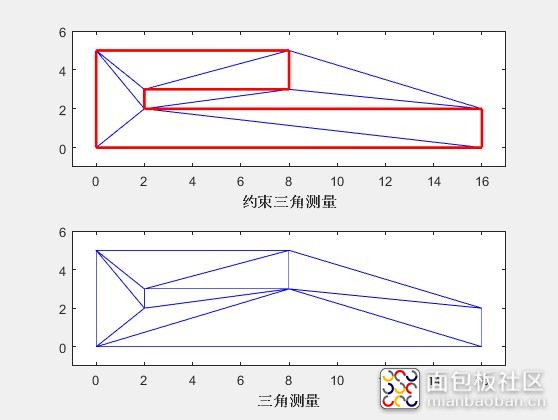
X = [0 0; 16 0; 16 2; 2 2; 2 3; 8 3; 8 5; 0 5];
C = [1 2; 2 3; 3 4; 4 5; 5 6; 6 7; 7 8; 8 1];dt = delaunayTriangulation(X, C);subplot(2,1,1);triplot(dt);axis([-1 17 -1 6]);xlabel('约束三角测量', 'fontweight','b');% Plot the constrained edges in redhold on;plot(X(C'),X(C'+size(X,1)),'-r', 'LineWidth', 2);hold off;% Now delete the constraints and plot the unconstrained Delaunaydt.Constraints = [];subplot(2,1,2);triplot(dt);axis([-1 17 -1 6]);xlabel('三角测量', 'fontweight','b');复制代码显示:
作者: curton, 来源:面包板社区
链接: https://mbb.eet-china.com/blog/uid-me-3876349.html
版权声明:本文为博主原创,未经本人允许,禁止转载!


 /5
/5 


文章评论(0条评论)
登录后参与讨论